Gas Mileage Explained: Costs, Causes, and Fixes
Gas mileage is how far your car travels per gallon; track it over at least three full tanks, and a sustained drop of about 10% or more usually points to more than normal variation. Ignore that change and you can burn hundreds a year on fuel or miss a tire, brake, sensor, or maintenance problem. This guide shows how to measure MPG correctly, convert it into fuel cost, and check the common causes in the right order.
What does gas mileage actually mean?
Gas mileage tells you how much fuel your car needs to cover distance, so it works best as a comparison tool and a diagnostic clue. In US terms, higher MPG means better fuel economy; in metric terms, lower L/100km means lower fuel consumption. The savings from higher MPG are real, but they do not rise in a straight line.
Use MPG for US comparisons
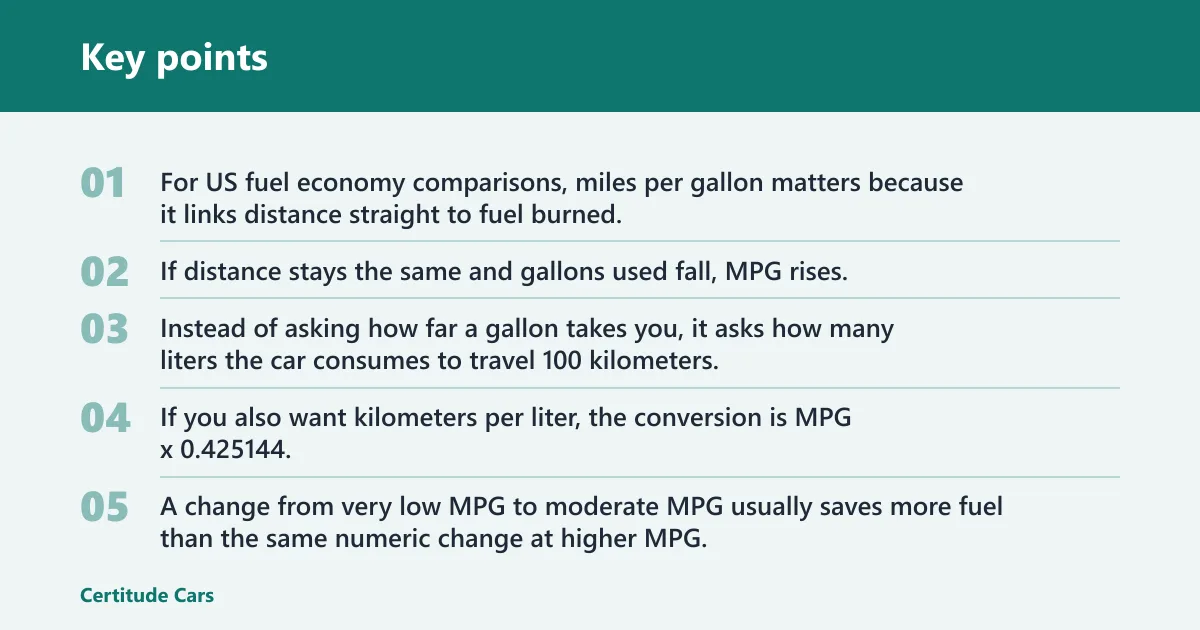
For US fuel economy comparisons, miles per gallon matters because it links distance straight to fuel burned. To calculate it, subtract the previous odometer reading from the current one to get miles driven, then divide that number by the gallons needed to refill the tank. If distance stays the same and gallons used fall, MPG rises.
That makes MPG useful when you compare one car to itself over time, one route to another, or one driving style to another. It also makes drops easy to spot once you log a few tanks.
Use L/100km when you want fuel consumption
L/100km flips the logic. Instead of asking how far a gallon takes you, it asks how many liters the car consumes to travel 100 kilometers. Lower is better.
The conversion is L/100km = 235.215 / MPG. If you also want kilometers per liter, the conversion is MPG x 0.425144.
Why MPG gains do not save equal dollars
A change from very low MPG to moderate MPG usually saves more fuel than the same numeric change at higher MPG. That is why a drop from 33 MPG to 28 MPG deserves attention, while a tiny swing around an already high MPG figure may have a smaller budget effect than expected.
Picture two commutes that are each about 1,000 miles a month. A fall from 33 MPG to 28 MPG adds about 5.41 gallons over that distance. At $3.79 per gallon, that works out to about $20.51 extra per 1,000 miles, or about $246 over 12,000 miles.
How do you measure gas mileage accurately?
The most reliable home method is full-tank-to-full-tank tracking with odometer readings, gallons used, and route notes. One tank can swing because of traffic, weather, or pump shutoff differences, so trust a trend only after at least three full tanks unless the drop is sudden and large in every condition.
Use the full-tank-to-full-tank method
- Fill the tank fully. Start with a complete fill-up and reset a trip meter if the car has one. Stop at the first automatic shutoff each time, or use the same topping-off habit each time, because inconsistent fill levels can skew the result.
- Record the odometer. Write down the current odometer or trip reading. Distance is current odometer minus previous odometer.
- Drive normally. Keep notes if the tank had unusual conditions such as heavy idling, strong wind, roof cargo, extreme cold, or mostly short trips. Those clues matter later when you decide whether the drop is normal or repair-worthy.
- Refill to full again. At the next fill-up, note the gallons added. That refill amount is the fuel used for the miles since the last fill.
- Calculate the result. Divide miles driven by gallons used to get MPG. Repeat for at least three tanks before calling it a trend.
Worked mileage example
The example from 18,420 to 18,732 miles covers 312 miles. Using 11.4 gallons in that example produces 27.37 MPG.
That same fill also lets you estimate fuel spend. At $3.79 per gallon, 11.4 gallons costs $43.21.
What to log besides miles and gallons
- Driving mix: mostly city, mostly highway, or mixed
- Weather: cold snap, headwind, snow tires, heavy rain
- Load and drag: passengers, cargo, roof rack, bike tray
- Maintenance clues: check-engine light, recent tire pressure loss, brake smell, rough idle
A common first-timer mistake is comparing one winter tank full of short school runs to a summer tank with a long highway trip. The math is correct, but the comparison is weak because several variables changed at once.
How do you turn MPG into real fuel cost?
Turn fuel economy into dollars by calculating total fuel cost first, then cost per mile, then the extra cost of any MPG drop over a month or year. This is the quickest way to decide whether the issue is minor variation, a driving-habit problem, or worth a repair bill.
Cost per mile and total fuel cost
Total fuel cost can be estimated as gallons used x price per gallon. Cost per mile is calculated by dividing total fuel cost by miles driven.
Using the 312-mile example above, 11.4 gallons at $3.79 costs $43.21. Dividing $43.21 by 312 miles gives a fuel cost of about $0.14 per mile.
Commute, trip, and annual examples
In the commute example, a 42-mile round trip at 31 MPG uses about 1.35 gallons per workday. That commute example estimates fuel cost at about $4.93 per day.
For an 860-mile road trip at 24 MPG, fuel needed is about 35.83 gallons. The road-trip example estimates fuel cost at about $139.37.
Those examples matter more when MPG falls. The mileage-drop example compares a usual 33 MPG with a recent 28 MPG average. Over 12,000 miles, that kind of drop can add about $246.12 in fuel at $3.79 per gallon.
Use cost per mile to judge fixes
Cost per mile helps sort smart fixes from weak ones. If a tire-pressure correction, roof-rack removal, or dragging-brake repair can recover a visible cost penalty, the payback is often clear. If the car lost only a tiny amount on one noisy tank, more tracking usually beats guesswork.
Say your crossover normally averages 33 MPG, then stays near 28 MPG for three tanks after a roof box went on for weekly highway runs. The extra fuel cost may be easier to justify than the inconvenience of removing it, but at least the tradeoff is visible in dollars.
When is a mileage drop normal, and when is it a problem?
Small swings from one tank to the next are normal because route mix, traffic, temperature, wind, idling, and short trips all change fuel use. A sustained drop of about 10% or more across at least three full tanks, or a sudden large drop in every condition, deserves inspection rather than more waiting.
Normal variation usually has a pattern
Cold weather, winter fuel blends, cabin heat demand, and short-trip use often pull MPG down without any fault. So do unusual headwinds, traffic jams, and heavier cargo.
Pattern matters. A city-only drop points in a different direction from a highway-only drop, and a cold-weather dip points in a different direction from a sudden all-condition loss.
Thresholds worth acting
- Keep tracking if the change shows up on only one tank and the trip mix changed.
- Inspect basics if the loss is about 10% or more for at least three full tanks.
- Move faster if the drop is sudden, large, and shows up in both city and highway driving.
- Book diagnosis sooner if a check-engine light, misfire, brake drag, or overheating clue appears with the MPG loss.
Sudden all-condition losses need quick checks
A sudden drop across city streets, steady highway runs, and warm restarts is less likely to be simple traffic noise. That pattern pushes tires, brakes, fuel quality, fault codes, thermostat behavior, or sensor issues much higher on the list.
How mileage reimbursement works
If you drive for work, mileage reimbursement usually means getting paid a set rate per qualified business mile, not for every mile you drive. The key details are which trips count, how the rate is set, and when a payment stays tax-free versus becoming taxable wages. Mileage reimbursement rules explains the 2026 mileage rate, which miles qualify, and how to avoid common recordkeeping and payroll mistakes.
This matters because the wrong policy can lead to denied deductions, extra tax liability, or overpaying employees for trips that are actually commuting or personal driving.
Gas mileage diagnostic table
| Symptom pattern | Likely cause | Quick test | Typical fix cost band | Fuel cost at a sample MPG drop |
|---|---|---|---|---|
| City-only drop | Short trips, idling, stop-start traffic, aggressive launches, low tire pressure | Track one week of route mix, check cold tire pressures, compare gentle and aggressive driving on the same commute | $0-$150 for pressure correction, driving change, basic maintenance items | Using 33 MPG vs 28 MPG at $3.79 per gallon: about $20.51 extra per 1,000 miles |
| Highway-only drop | High speed, roof rack or cargo box drag, underinflation, alignment, dragging brakes | Remove exterior cargo for one tank, verify pressures cold, check for steering pull or hot wheel after a drive | $0-$300 for rack removal, tire correction, alignment; more if brakes are dragging | Using 33 MPG vs 28 MPG at $3.79 per gallon: about $20.51 extra per 1,000 miles |
| Cold-weather drop | Winter fuel blend, longer warm-up, denser air, cabin heat load, repeated short trips | Compare similar routes after weather changes, note trip length, watch whether MPG recovers on longer warm drives | $0 if seasonal; $20-$150 if tire pressure or deferred maintenance also changed | Using 33 MPG vs 28 MPG at $3.79 per gallon: about $20.51 extra per 1,000 miles |
| Sudden all-condition drop | Dragging brakes, misfire, oxygen-sensor or check-engine issue, thermostat problem, bad fuel, major tire loss | Check warning lights, tire pressures, brake heat, idle quality, and whether the engine reaches normal temperature | $0-$200 for basic correction; higher if brake or sensor repairs are needed | Using 33 MPG vs 28 MPG at $3.79 per gallon: about $20.51 extra per 1,000 miles |
What causes gas mileage to drop in city driving?
City MPG falls fastest when the car spends more time idling, warming up, accelerating from stops, and braking back down. Short trips make that worse, and aggressive driving can cut city mileage by 10% to 40%, so city-only drops often start with route and behavior checks before deeper repair work.
Short trips and stop-start traffic
City driving stacks the deck against fuel economy. Fuel use keeps going while the car sits at lights or in drive-through lines, every launch from a stop takes extra energy, and short trips leave less time at efficient operating temperature.
If your route shifted from one 20-mile errand loop to five 3-mile trips, a lower tank average may be normal even if nothing is wrong.
Aggressive driving and wasted momentum
Hard acceleration and rapid braking burn fuel twice: once to gain speed quickly and again when that energy is thrown away in braking. The supplied evidence range is wide for a reason; traffic density, engine size, and route all matter.
In city driving, aggressive driving can reduce mileage by 10% to 40%. On the highway, the same habit can drop mileage by 15% to 30%.
Tires, cargo, and accessory loads
Low tire pressure adds rolling resistance every second the car moves. A useful rule of thumb is about a 0.2% mileage reduction per 1 psi drop across all four tires. If all four tires are 5 psi low, the MPG hit is about 1%.
Extra weight hurts city MPG more than many drivers expect because the car must get that weight moving over and over. Air conditioning, defrosters, and other accessory loads can also pull city averages down, especially on low-speed trips.
Why does highway fuel economy sometimes get worse?
Highway mileage is often better than city mileage, but not automatically. Speed, aerodynamic drag, roof cargo, heavy load, tire pressure, alignment, and brake drag can erase the highway advantage, and once speed rises enough, fuel use climbs faster than distance covered.
Speed is the first highway check
Highway fuel economy depends on steady motion, but it also depends on keeping aerodynamic drag under control. As speed climbs, the force needed to push air aside rises sharply, so the biggest highway fuel penalty shows up at higher cruising speeds.
If the route is the same but cruising speed drifted upward, that alone can explain a highway-only MPG drop.
Roof racks and exterior drag
Roof racks and cargo carriers are major diagnostic clues because they hit highway MPG harder than city MPG. The supplied figures are substantial: they can reduce fuel economy by up to 8% in city driving and by up to 25% at highway speeds.
Suppose a sedan keeps its usual city MPG but loses a noticeable amount only on weekend interstate trips after a pair of upright bike carriers goes on. That pattern points to drag first, not to a sensor or tune-up item.
Tires, alignment, and brake drag
Underinflation hurts highway efficiency too, and alignment problems can add rolling resistance even without obvious tire wear at first. Dragging brakes are more serious because they waste fuel and overheat components.
After a drive, a steering pull, a hot wheel, or a brake smell raises the priority of a brake or alignment check.
How can you tell driving habits from mechanical problems?

Driving-habit losses usually follow a clear pattern tied to route, speed, weather, load, or trip length; mechanical losses tend to persist across different conditions and often bring extra clues such as rough running, warning lights, brake heat, or slow warm-up. The fastest answer comes from matching the symptom pattern before replacing parts.
Pattern clues that point to habits
A loss that appears only in heavy traffic, only on short cold trips, or only when roof cargo is mounted usually starts outside the engine bay. The same is true when the drop follows a change in driving pace or commute route.
If the average improves again on a long, warm, unloaded drive, a mechanical fault becomes less likely.
Pattern clues that point to hardware
Dragging brakes, misfires, thermostat issues, oxygen-sensor problems, wheel alignment issues, and overdue maintenance can all lower fuel economy. The maintenance examples that often come up include low tire pressure, a dirty air filter, and dragging brakes, but they do not carry equal weight in every case.
Air filters are easy to inspect, yet they are not the top answer for every modern MPG complaint. Brake drag, sensor faults, and temperature-control issues can create a much bigger all-condition loss.
Fast checks before booking diagnosis
- Check tire pressures cold. Set all four to the vehicle placard specification before driving far. This removes a common, measurable source of rolling resistance.
- Scan for warning clues. Note any check-engine light, rough idle, hesitation, hard starting, or unusually slow warm-up. Those symptoms push the car out of the “keep tracking” category.
- Inspect for drag signs. After a normal drive, watch for pulling, a hot wheel, or a brake smell. A dragging brake can cut MPG and create a safety problem at the same time.
- Remove extra drag. Take off unused roof racks or cargo carriers for one tank if practical. A clean A/B comparison is more useful than guessing.
- Compare like with like. Recheck MPG on the same route type, with similar load and weather, across at least three full tanks. That is how normal variation gets separated from a true trend.
What fixes usually make sense first?
Start with the cheapest checks that fit the symptom pattern: accurate tracking, tire pressure, roof-rack removal, route comparison, and obvious maintenance clues. Repairs make the most sense when the drop is sustained, the cost per 1,000 miles is clear, or the car shows signs such as brake drag, fault codes, or misfire.
High-odds, low-cost first moves
Pressure correction costs little and has a direct, measurable effect. Removing exterior drag costs nothing if the rack or carrier is not needed. Logging three comparable tanks also costs nothing and often prevents unnecessary parts-swapping.
If the car recently changed from mixed driving to short urban trips, route correction may matter more than any repair.
Repairs with clearer payback
A sustained 33-to-28 MPG drop adds about $20.51 per 1,000 miles at $3.79 per gallon. That turns into about $246.12 over 12,000 miles, which starts to justify diagnosis for brake drag, alignment trouble, thermostat faults, or sensor issues if the loss will continue.
By contrast, chasing a tiny one-tank dip without pattern clues often costs more in time and guesswork than the fuel itself.
When to stop tracking and book service
- The drop is sudden and affects both city and highway driving.
- The car misfires, runs rough, or turns on the check-engine light.
- The engine does not seem to reach normal temperature.
- One wheel is abnormally hot, the car pulls, or braking feels off.
- The MPG loss stays at about 10% or more after the basic checks above.
Frequently asked questions
How much can low tire pressure hurt gas mileage?
Low tire pressure increases rolling resistance all the time, so the MPG hit adds up quickly. A common rule of thumb here is about a 0.2% mileage reduction per 1 psi drop across all four tires, which means a uniform 5 psi loss costs about 1% in fuel economy.
Is highway driving always better for fuel economy?
No. Steady cruising often beats stop-and-go traffic, but high speed, strong headwinds, heavy loads, roof racks, open carriers, underinflated tires, and dragging brakes can wipe out that advantage. Highway MPG is best when speed is moderate, drag is low, and the car is mechanically free-rolling.
When does speeding waste the most fuel?
Speeding hurts fuel economy most on faster highway runs, where aerodynamic drag rises sharply and the engine must work harder just to push air aside. A small increase in cruising speed can cost more fuel than many drivers expect, especially if roof cargo adds even more drag.
What maintenance issues can lower gas mileage?
Low tire pressure, dragging brakes, wheel alignment problems, misfires, oxygen-sensor or check-engine issues, thermostat problems, and overdue maintenance can all reduce fuel economy. A dirty air filter can matter too, but it should be judged in context rather than treated as the default answer.
Why is my gas mileage suddenly getting worse?
Sudden MPG loss usually means the change is bigger than normal tank-to-tank variation, especially if it shows up in both city and highway driving. Start with tire pressure, brake drag, warning lights, and route changes; if nothing obvious fits, a fault code or temperature-control issue moves higher on the list.
How do I turn MPG into fuel cost per mile?
First calculate total fuel cost by multiplying gallons used by price per gallon. Then divide that fuel cost by miles driven to get cost per mile. This number is useful for commute budgeting, trip planning, and estimating how much a sustained MPG drop is costing each month.