Engine Specs Explained: Horsepower, Torque and Size
Engine specs only make sense as a set: torque, the rpm where torque peaks, horsepower, the rpm where power peaks, and displacement each tell a different part of the story. Read one number in isolation and you can end up paying for a headline figure that feels slower, uses more fuel, or suits your driving less well. This guide explains horsepower, torque, rpm, displacement, and how to compare spec sheets by real-world use.
Read the spec sheet first
A useful engine listing is more than one bold number. You want horsepower, torque, the rpm for each peak, displacement, aspiration type, fuel type, and ideally a torque or power curve. Without the rpm points, two engines with the same peaks can behave very differently on the road.
The fields that matter most on one line
Start with the full line, not the biggest number. A proper comparison includes horsepower, torque, the rpm where each occurs, and engine size in litres or cc. If the car is turbocharged, that should be stated too, because boost can change low-rpm torque in ways displacement alone cannot predict.
US spec sheets often show horsepower in hp and torque in lb-ft. Many global sheets use kilowatts for power. The calculator conversion commonly used is 1 hp = 0.7457 kW.
What a complete engine listing should include
For a shopper, the minimum useful entry looks like this: peak horsepower with rpm, peak torque with rpm, displacement, cylinder count, and whether the engine is naturally aspirated or turbocharged. Transmission gearing and vehicle weight belong in the next line of the comparison, because they strongly affect acceleration feel.
The missing details that can distort a comparison
The biggest omission is rpm. “300 lb-ft” means much more if it arrives low in the rev range than if it appears near redline. Another problem is mixing standards, such as comparing one factory rating with another car’s dyno result. That is not a like-for-like comparison.
A common first-timer mistake is comparing a single horsepower number across trims and assuming the bigger number will always feel stronger. Subaru trim comparisons are often presented that way, and model ranges can span widely; one published example lists the WRX STI at 305 hp, while Acura NSX figures in published comparisons range from 270 to 573 hp. Those ranges show why context matters: the number alone does not tell you where the engine makes its effort, or what the car weighs.
What do horsepower, torque and engine size actually mean?
Horsepower is the engine’s power output, torque is the crankshaft’s twisting force, and engine size is displacement, usually shown in litres or cc. RPM ties them together. Read as one system, those numbers tell you whether an engine is likely to feel eager off the line, stronger in the middle, or happiest at higher revs.
Horsepower: power output over time
Horsepower measures how quickly the engine can keep doing work as rpm and road speed build. On a spec sheet, it is the number most often used to compare trims and models because it gives a quick read on sustained output at speed. That shortcut can mislead if you ignore where the engine makes that power.
US listings usually show hp. Many global listings show kW. If you need the conversion, 1 hp = 0.7457 kW.
Torque: twisting force at the crankshaft
Torque is the turning force produced by the engine, commonly listed in lb-ft on US car spec sheets. It helps explain launch feel, low-speed response, and part of what drivers describe as pull. It also matters in towing feel, though torque alone does not set tow capability; gearing, cooling, and vehicle rating matter too.
Engine size: displacement in litres or cc
Displacement is the total volume swept by all the pistons as they move from top to bottom dead center, usually shown in litres or cubic centimeters. It comes from bore, stroke, and cylinder count. Bigger displacement can let an engine move more air and fuel per revolution, but it does not guarantee more horsepower, more torque everywhere, or a quicker car.
RPM: the speed that ties the numbers together
RPM is engine rotational speed. It matters because torque without rpm is incomplete, and horsepower cannot be read correctly without it. Peak torque and peak horsepower usually show up at different rpm points, which is why an engine can feel strong in one part of the rev range and ordinary in another.
Honda’s K-series examples show this clearly. The K24W7 made 206 horsepower at 6,800 rpm and 182 lb-ft at 4,500 rpm. The 2006-08 Acura TSX K24A2 made 205 hp at 7,000 rpm and 164 lb-ft at 4,500 rpm. The 2014-2015 Honda Civic Si K24Z7 made 205 hp and 174 lb-ft of torque. Similar headline power, different torque numbers and rpm placements.
How are horsepower and torque connected?
Horsepower and torque are linked by rpm. In US units, horsepower equals torque in lb-ft multiplied by rpm, then divided by 5252. That is why torque and horsepower peaks often happen at different engine speeds, and why the two curves cross at 5252 rpm on a lb-ft versus hp chart.
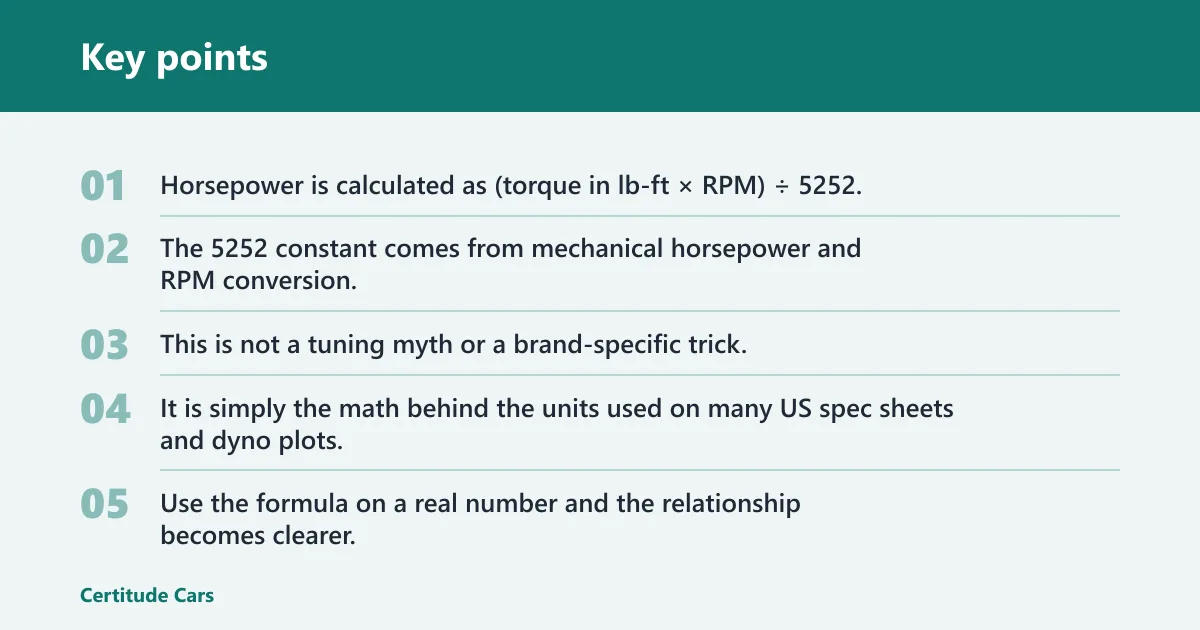
The formula: torque × rpm ÷ 5252
Horsepower is calculated as (torque in lb-ft × RPM) ÷ 5252. The 5252 constant comes from mechanical horsepower and RPM conversion. This is not a tuning myth or a brand-specific trick. It is simply the math behind the units used on many US spec sheets and dyno plots.
Use the formula on a real number and the relationship becomes clearer. A 300 lb-ft torque engine at 4,000 RPM makes about 228.5 horsepower. Converted with 0.7457, that is roughly 170.4 kW.
Why peak torque and peak horsepower arrive at different rpm
Engines do not produce the same torque at every speed. Breathing, cam timing, turbo boost control, intake tuning, exhaust flow, and friction all change output across the rev range. As rpm climbs, horsepower can keep rising even after torque has peaked, because horsepower depends on both torque and rpm.
That is why a car can feel muscular at low revs yet run out of breath early, or feel calm below midrange and then come alive near the top. The shape of the curve matters more than the isolated maximum.
Why the curves cross at 5252 rpm
The 5252 crossover is where torque and horsepower numerically match. That happens because the formula uses 5252 as the divisor when torque is in lb-ft and power is in hp. On a dyno sheet using those units, the crossing point is a mathematical property, not a sudden change in engine behavior.
Converting horsepower to kilowatts
If a global spec sheet gives power in kW and a US listing uses hp, convert before you compare. The conversion factor is 0.7457. That keeps you from treating two labels as two different performance levels when they are only two different unit systems.
Does engine size mean the car is faster?
Engine size sets part of an engine’s potential, not the final result. Turbocharging, rpm range, airflow, tune, gearing, and vehicle weight can let a smaller engine match or beat a larger one in power or real-world response. Litres tell you something, but never enough on their own.
Why displacement sets potential, not outcome
More displacement usually means more swept volume per revolution. That can support more torque, especially without relying heavily on boost. But output depends on how efficiently the engine fills its cylinders, how high it revs, and how the rest of the powertrain uses that output.
How turbocharging changes the picture
A small turbo engine can produce strong low-rpm torque by forcing more air into the cylinders. That is why modest-displacement engines can feel punchy in everyday driving. The tradeoff is often in delivery shape: a fat early torque band may arrive before the engine pulls strongly at higher rpm.
Picture two trims with similar peak horsepower. One uses a larger naturally aspirated engine, the other a smaller turbo engine. On paper they tie at the top line. In traffic, the turbo car may feel stronger with lighter throttle because its torque arrives earlier. On a long uphill run at higher rpm, the larger engine may feel steadier if it carries power further up the rev range.
Large low-output engines versus small high-torque turbo engines
This is where specific output helps. A large-displacement engine with modest horsepower per litre may be tuned for durability, smoothness, or easy torque. A smaller turbo engine with similar peak horsepower may make that power with a narrower, boosted torque swell. Neither layout is automatically better. The useful question is where the engine delivers its effort for the job you need.
Specific output is a better comparison than litres alone
Specific output means power relative to displacement. It will not tell you everything, but it is better than using litres as a proxy for speed. Honda’s K24 and K20 examples show why. The K24 is a 2.4-liter engine, while the K20 is a 2.0-liter engine. The K24 also has a 99mm stroke compared with the K20’s 86mm stroke. Those design differences help explain why engines with related architecture can still have different torque character and rpm habits. (Motortrend)
What does displacement tell you beyond litres and cc?
Displacement tells you more than size. Because it comes from bore, stroke, and cylinder count, it hints at the engine’s breathing style, rpm range, and torque character. It cannot predict output by itself, but it does help you judge whether an engine is likely to make its effort low, midrange, or high in the rev band.
How bore and stroke create displacement
Bore is the cylinder diameter. Stroke is how far the piston travels. Multiply those dimensions by cylinder count and you get total swept volume, which is the displacement shown on the spec sheet in litres or cc.
Oversquare, undersquare, and what they usually signal
When bore is larger than stroke, the engine is often described as oversquare. When stroke is longer than bore, it is often called undersquare. In broad terms, shorter-stroke combinations can support higher revs more easily, while longer-stroke combinations often lean toward stronger torque character lower in the range. Those are tendencies, not guarantees.
Why stroke often shapes torque character
Stroke affects piston speed and the engine’s mechanical rhythm across the rev range. A longer stroke often supports a torque-biased feel at lower and mid rpm, while a shorter stroke can suit higher-rpm operation. The K24 versus K20 stroke difference is a clear example of how related engines can be aimed at different character, not simply different size.
How rev range changes what the same displacement can deliver
Two engines with the same litres can behave nothing alike if one is tuned to breathe and rev harder. That is why displacement should be treated as context, not a verdict. You are reading for potential and character, then checking the torque and horsepower curves to see how that potential was used.
How do these specs change the way a car drives?
They change where the car feels strong. Low-rpm torque shapes easy launches and city response, midrange output affects passing, and the power curve at sustained rpm matters under towing or long grades. Heat, altitude, gearing, and weight can shift which engine feels better even when peak numbers look close.
City driving and low-rpm response
In stop-and-go driving, an engine that makes useful torque early usually feels more relaxed. You need less throttle, fewer downshifts, and less revving to move cleanly with traffic. That is why peak torque rpm matters as much as the peak number.
Highway passing and midrange pull
Passing is usually a midrange event, not a redline event. If an engine has a broad torque band through the rpm your transmission uses on the highway, it will often feel stronger than a peaky engine with the same headline horsepower.
Say your commute includes a short uphill merge where the transmission drops to midrange rather than maximum rpm. In that case, the engine with more torque in the middle of the rev range may feel quicker and calmer, even if both trims advertise nearly the same peak horsepower.
Towing, payload, and sustained load
Towing raises the stakes because the engine works under load for longer. Torque helps the vehicle get moving and hold speed, but tow confidence also depends on transmission ratios, cooling capacity, final drive, and the manufacturer’s tow rating. A strong torque peak with weak thermal management can still feel strained on a hot grade.
Heat, altitude, and why use case changes the answer
Hot weather and high altitude can change what matters most. Engines lose some effective breathing as conditions get harsher, and sustained climbs expose cooling and gearing weaknesses that a short test drive may not reveal. For mountain use or summer towing, look beyond the brochure peak and focus on the usable part of the curve, plus the vehicle’s rated application.
Engine specs decoder table
| Spec term | Unit | What it tells you | Common trap | Buying takeaway |
|---|---|---|---|---|
| Horsepower | hp or kW | Power output, useful for sustained acceleration and higher-speed work | Comparing hp alone across trims without checking rpm, weight, or gearing | Use it with torque and rpm, then ask where the engine makes that power |
| Torque | lb-ft | Twisting force, useful for launch feel, low-speed response, and part of towing feel | Treating peak torque as the whole towing story | Check the torque peak rpm and whether the curve stays broad in normal driving |
| Peak horsepower rpm | rpm | Where the engine reaches maximum power | Ignoring that a very high-rpm peak may be rare in daily use | If you seldom rev high, value the shape below that peak |
| Peak torque rpm | rpm | Where maximum twisting force occurs | Reading the torque number without the rpm attached | Earlier peak torque often matters more for commuting and loaded driving |
| Displacement | L or cc | Total swept volume from bore, stroke, and cylinder count | Assuming bigger litres means quicker car | Treat it as potential and character, not a ranking by itself |
| Bore and stroke | mm | Core dimensions behind displacement and rev character | Using them as a shortcut to predict everything about performance | Use them to judge likely rev range and torque bias, then confirm with the curve |
| Aspiration | NA or turbo | How the engine fills its cylinders | Assuming turbo always means better or worse | Expect delivery differences; compare where torque arrives and how long it lasts |
| Dyno sheet | hp and lb-ft versus rpm | The full torque and power curves under measured conditions | Comparing a dyno result directly with a factory rating | Use dyno charts to read shape and spread, not to settle marketing claims alone |
| Transmission ratios | gear ratios | How the car multiplies and uses engine output | Ignoring gearing when engines have similar peaks | Close ratios can keep a peaky engine in its sweet spot; tall gearing can blunt response |
| Vehicle weight | lb or kg | How much mass the engine must move | Comparing engine specs without considering the car around them | Similar engines can feel very different in lighter or heavier trims |
How do you compare two engines with similar horsepower?
If horsepower is similar, start with torque peak rpm, then look for the shape of the torque and power curves. Add transmission ratios, vehicle weight, and intended use. That process usually reveals which engine will feel stronger in traffic, pass more cleanly, or cope better with load.
Start with where peak torque arrives
An engine that reaches strong torque earlier often feels easier in daily driving. If the torque peak arrives much later, the car may need more revs or a more aggressive downshift to feel equally lively.
Read the curve, not only the peak number
A broad plateau is often more useful than a sharp summit. Dyno sheets help here because they show how torque and horsepower rise, flatten, and fall across rpm. Factory ratings give the summary. Dyno charts show the full shape.
Check transmission ratios, weight, and drivetrain
Even when engines look similar, the car around them can change the result. A shorter final drive can make a weaker engine feel alert. Extra mass can hide a strong top-end engine. Drivetrain losses also affect wheel output, which is one reason dyno numbers can differ from manufacturer ratings.
Use a five-step buyer decision framework
- Write down horsepower and the rpm where it peaks.
- Write down torque and the rpm where it peaks.
- Ask which rpm band you use most: city, highway passing, or sustained load.
- Check transmission ratios, curb weight, and whether the engine is turbocharged or naturally aspirated.
- Choose the engine whose torque and power curves best match that use, not the one with the louder headline number.
Dyno sheets, factory ratings and marketing traps
A factory spec sheet gives certified peak numbers. A dyno sheet shows how the engine delivers output across rpm in measured conditions. Both matter, but they are not interchangeable. Marketing often favors the biggest isolated figure, which is exactly why shoppers should check rpm, units, and test context.
What a dyno chart can tell you that a spec sheet cannot
A dyno sheet plots torque and horsepower across the rev range. That lets you see early torque build, flat spots, taper, and whether the engine has a narrow or broad useful band. For choosing between similar trims, that shape often matters more than a single peak.
Why dyno results differ from manufacturer ratings
Manufacturer ratings are published output figures under defined test conditions. Dyno results depend on the dyno type, correction method, ambient conditions, and whether the measurement is at the engine or through the drivetrain. Use them to compare curves and trends, not as interchangeable labels.
Common ways specs are presented to sound stronger
The easy traps are familiar: quoting torque without rpm, quoting horsepower without stating units, mixing factory numbers with dyno numbers, or treating a temporary peak as the whole character of the engine. Another trap is leaving out displacement and aspiration so the buyer cannot see how the engine likely delivers its output.
Checklist for incomplete or misleading listings
- If peak torque is listed, check whether the rpm is listed too.
- If power is shown in hp on one car and kW on another, convert before comparing.
- If one source uses factory ratings and another uses dyno output, stop and normalize the comparison.
- If towing is part of your use, check tow rating, cooling, and gearing, not only torque.
- If the listing shows litres or cc only, treat it as incomplete until you see torque, horsepower, and rpm.
- If the engine is turbocharged, look for how broad the torque band is, not only how high the peak is.
Frequently asked questions
How do horsepower and torque affect how a car drives?
Torque shapes the immediate feel at lower and mid rpm, so it often matters most in launches, city driving, and relaxed passing. Horsepower reflects how much work the engine can keep doing as speed and rpm rise. The best reading comes from where those outputs appear across the rev range.
What does displacement mean on an engine spec sheet?
Displacement is the total swept volume of all cylinders, usually shown in litres or cc. It comes from bore, stroke, and cylinder count. It hints at an engine’s potential and likely character, but it does not directly tell you horsepower, towing ability, or how lively the car will feel.
Which is more important, horsepower or torque?
Neither wins on its own. Torque matters a lot for low-rpm response and load feel, while horsepower matters for sustained acceleration and higher-speed work. The better question is where each peak occurs and how broad the useful range is for the driving you actually do.
Why do horsepower and torque curves cross at 5252 rpm?
On charts that use lb-ft for torque and hp for power, they cross at 5252 rpm because horsepower is calculated as torque times rpm divided by 5252. That crossover is a unit-based mathematical result. It does not mark a special mechanical event inside the engine.
How do I convert torque and rpm into horsepower?
Multiply torque in lb-ft by rpm, then divide by 5252. If you want kW, convert that horsepower figure using 0.7457, which gives roughly 170.4 kW for the same example.